Everyone! We've moved to WordPress.

Rollovers for Gantt Charts

2
Before we start, you might have noticed some renovations on this blog. Yeah, it was time for a change. I'm working this template out, so sorry if some of the formats seem off. Also, I have started a new facebook page. I'll be keeping it updated with stories from my favorite blogs. Also, you can post questions and stuff for me (or others) to take a crack at. Plus, you'll see that I'm just a normal average guy. So if you have a facebook, you should join. You really don't have a good excuse why not! :)

DOOOOOOOOOOOOO IT!
Option Explicit VBA | Promote Your Page Too


***

In early last year, this humble blog had very little traffic. All of that changed in April of last year when I posted an exciting discovery: the Rollover technique. This technique was written about by the wonderful Purna of Chandoo.org. At the time, I was super excited about all of the possibilities of this technique. Now, just about a year later, I'm unsure whether anyone (besides me) has really ever used it. I even tried to incorporate it into my last project, but I found my clients were all too used to clicking on a cell rather than rolling over one. In the end I removed the rollover and replaced it with a click. Perhaps the rollover technique is destined to be a cool gimmick and not much more.

But I'm not giving up. Reader Bert van Zandbergen has been sending me many fine spreadsheets featuring this technique. His enthusiasm is encouraging. So I give you a rollover you can use for your Gantt Charts!
Unable to display content. Adobe Flash is required.

Download the fun, here:
Gantt Chart Surprise.xlsm

To see my intermediate table, scroll to the right of the dashboard. Sometime in the short future, I'll post a how to make the highlighted cell stand out with a border. In the mean time, remember to go to Facebook and like this page. Seriously, what are you waiting for? 

Easy One-Way Sensitivity Analysis on Weighted Sum Models in Excel (Part 2)

0
Wow, it's been a while since my last article. I've actually been pretty busy the last few weeks putting the finishing touches on an Excel deliverable for one of my company's clients. We delivered the product about a week ago and things have just now started to slow. So now it's back to blogging.

If you've been following so far, we left off with Easy One-Way Sensitivity Analysis on Weighted Sum Models in Excel (Part 1). In that article, I describe a method for automating one-way sensitivity analysis, and, in Part 1, we construct the mechanism that drives the automation. However, where we left off, our sheet was a bit ugly. Sure, the mechanism worked, but it wasn’t a dashboard. We’ll talk about making a dashboard in this article, Easy One-Way Sensitivity Analysis on Weighted Sum Models in Excel (Part 2). If you’re scratching your head at this point (“what the heck is sensitivity analysis?”), go ahead and start with Part 1. There, I give a brief introduction to the mathematics and rational behind sensitivity analysis (and the weighted-sum model) before going into the Excel stuff. Also, these tutorials are a bit on the long side, so you may just want to do the analog thing and print them out instead of following along on here. 

I’ve been scratching my head as to how to segue from my last article to this one. I’ve decided to do what good chefs do and start with something already prepared. So go ahead and download this file: Healthcare Sensitivity Analysis Example.xlsx. You’re welcome, of course, to recreate the layout of that file, but I’ve done the heavy lifting for you. The core difference between this file and the one you created in the last blog post is that I’ve added many more countries (with fake data). Let’s get the lay of the land of this new file.

If you start with the Data tab you’ll something similar to our last blog post.


The table on the left isn’t all that different from the last file. If you play with the scrollbars, you’ll see that they work exactly as they did before. In the table to the right, each metric has more information broken out than in our last spreadsheet, but the mechanism we created before is exactly the same here (notwithstanding the extra information). Note, too, that the final weighted scores have been moved the front (that is, to the first column on the left) of the final table. You’ll see why at the end of this tutorial.

(The reason more info is broken out is because that info is used in the Healthcare Analysis dashboard in the Fun Downloads section. We won’t use those extra columns here, but if you get the hang of this stuff, consider creating a dropdown to individual weighted scores using that extra information. I might write about how to do that in a Part 3.)

Now click the Example tab. You should see the barebones of our dashboard. If you scroll all the way down (or zoom out) you should see another table below the dashboard called VLookup Table.

Dashboard 

Intermediate Table

This table is an important, if unnecessary, intermediate step. I say unnecessary because you could go without out, but I wouldn’t recommend it; the table makes life much easier. So, this is my advice: whenever you make a dashboard, you should have an intermediate table off-screen that summarizes most of the selection and number crunching for you. For the computer science and java geeks out there, think of this table as part of the model-view-controller framework. The dashboard is our view, or “reporting” layer – it reports data to the users, but it doesn’t allow them to make specific underlying changes to it (they can only change how the data is shown to them). This intermediate table acts kind of like a controller. It handles input stuff like scrolling, and it’s usually only for the Excel developer and not for the client or front-end user (that’s why it’s off-screen). Finally, the underlying data on the backend is our model. I admit that’s a pretty rough explanation, but it serves this very fundamental point to dashboard creation: you should separate the reporting, event handling, and underlying data areas on your spreadsheet. This separation mitigates damage caused by underlying and user-created errors and separates the logic of your work into distinct modules. In other words: it makes life easier.

Let’s go.

Step 1: Link the percentages from your data to your dashboard. 


Start by selecting cell I3 on the Example tab and link it to cell E4 on the Data tab, which holds its corresponding weight. Then go across the boxes on your Example tab and ensure that each cell is linked to its correct proportion on the data tab. Your numbers might be different from mine above, but if you do everything correctly, your mapping should look like this:
Health Level                → Data!E4
Responsiveness              → Data!E5
Financial Fairness          → Data!E6
Health Distribution         → Data!E7
Response Distribution       → Data!E8
It’s always good to double-check to make sure your references are correct. Check twice, reference once.

Step 2: Copy the scrollbars to your dashboard. Resize accordingly.

Remember those scrollbars from the last blog post? They’ll come in handy here. Go to the Data tab. While holding down Ctrl, select all five scroll bars by clicking each one individually. Press Ctrl+C to copy them. Next, go to your dashboard on the Example tab. Press Ctrl+V to paste to your dashboard.

You’ll now need to adjust the size of each scroll bar – then position it next to each number as shown below.
 

Pro Tip: You can make your life easier by selecting the first scrollbar on the left (select it with a Ctrl+Left-Click) on your dashboard. Move the control on top of, or near, the Health Level box and adjust it to the desired height. Use the arrow keys on your keyboard to fine tune its placement (you may need to adjust the height one more time). When you like the scrollbar’s size and position, right-click and select Format Control. Select the Size tab. Take note of its current Height and Width (write it down if you need). Click OK.

Now select all of the remaining scrollbars using the Ctrl+Left-Click as you did in Step 1. Right-click any one of the selected scrollbars, then select Format Control. In the Height and Width boxes enter the information you just noted. Click OK. Each scroll bar is now the right size. Move each scrollbar next to its associated number. Use the arrow keys to fine tune if you’re neurotic (like me!).


Lookin’ good….

Step 3: Create the scrolling indices to show each country.

On the Example tab, scroll all the way down to the VLookup table. In cell F32 of the Example tab you should see only the value “1” alone, by itself. In the cell below the 1 (F33), type =F32 + 1.

Hit Enter. Now drag cell F33 down until you reach the value of 15. Next, go to the Developer tab and insert another From Control scroll bar to the left of the column of numbers we just created. Just like in Step 1, we’ll link this scroll bar to a specific cell on the sheet; in this case, we’ll link it to the cell that held the 1, cell F32. So right-click the scroll bar, then select Format Control. Click the Control tab. In the cell-link box, select (or type) F32. Click OK.

Press the up and down arrows on the scroll bar to see the indices change.

Step 4: Use the indices to pull the final weight values from the Data tab.

Here, we’ll use the scrolling indices to pull information from the Data tab. We can use the Large() formula to ensure the data we pull is sorted. Use the scrollbar to scroll up so that there is only a 1 in F32. (If you see a zero in F32, you’ve scrolled too far. Scroll up one.) Now, in the cell to the right of it, type "=Large(". Now select the entire column of Final Weights from your data tab, Data!G4:G53.


Hit F4 to make it an absolute reference. Type a comma to go to the next parameter. Now, go back on your Example tab, select the 1 (cell F32) to the left. Your formula for F3 should look like this:
=LARGE(Data!$G$4:$G$53,Example!F32)
What we’ve told Excel to do is pull the greatest value from the set of Final Weights. Hit Enter.

If we drag that formula all the way down, we are then telling Excel to pull the second largest value, third largest value, and so forth. Thus, the resulting values in the Largest Values column are always nth largest value, where n is the number in the cell to the left. That’s how we make an automated sorted list. 

Step 5: Fix the Scrollbar minimum and maximum values.

If you play with the scroll bar, you’ll see that scrolling all the way up or scrolling up the way down results in #NUM errors. This happens because we only have 50 countries to choose from. Indices less than one or greater than fifty are outside the bounds of our set. So right-click the scrollbar, select Format Control. Select the Control tab.

Right away, we know that the Minimum value should be 1. But if we have 50 countries in our set, what do you think the maximum value should be? Hint: it’s not 50. Remember, we’re only changing the value in cell F32, the rest of the values are calculated for us on the spreadsheet. So the maximum value should actually be 36. Why? Because while we have 15 different indices showing, one of them is the cell link and the other 14 are calculated on the spreadsheet. 50 – 14 = 36.

In Sum: 
Minimum Value: 1
Maximum Value: 36 
Click OK.

If you play with the scrollbar, you’ll see that it keeps the indices within the correct bounds.

Step 6: Use VLookup to take largest values to its corresponding information.

In the first cell to the right of the Largest Values column (cell H32), we’ll use the Weight Value to the left as a lookup value. Now, do you see why I moved the final weighted scores all the way to the left on the ata tab? It’s a lookup column now! So, in Cell H32, you’ll have something like the formula shown below. But rather than typing what I have, try to recreate the formula yourself. Then double-check to ensure that our work agrees. 
=VLOOKUP(G32,Data!$G$4:$R$53,2,FALSE)
(1) G32 is the weighted score;
(2) Data!$G$4:$R$53 is the entire table from the Data tab;
(3) 2 tells us to pull from the second column, that’s the name of the country we’re interested in; and,
(4) FALSE ensures an exact match.
But wait, the VLookup Table on the example tab has a column for each metric, and we've only filled in info for one column. We’re not just interested in the second column from the table on the data tab. We’re actually interested in columns 2, 4, 6, 8, 10, and 12 as demarcated in red below.


We can actually pull all that info out with only one VLookup. On your data tab, select H32. Now, rewrite the VLookup formula as follows:

=VLOOKUP(G32,Data!$G$4:$R$53,{2,4,6,8,10,12},FALSE) 

Note we have changed the formula from looking up only column 2 to looking up a set of columns. Ensure that you use the curly braces to surround your set of columns as shown above. Now drag the selected cell to the right until you reach column M, the end of the Vlookup table. With H32:M32 still selected, click into the formula bar, then press Ctrl+Shift+Enter. Viola! We use the Ctrl+Shift+Enter here because the VLookup is returning an array of numbers and not just one number. Now drag the selected row all the way down to fill the table. If you’ve done everything correct so far, your table should look like mine.


Use the scrollbar to see the values change.

Step 7: Map the values from the intermediate table to the dashboard.

First, select the scrollbar to the left of your VLookup Table. Press Ctrl+C to copy. Scroll all the way up to the dashboard. Now paste. Move this new scrollbar to a location on your screen that makes sense. You could put it between columns E and G. Or, you can put on the right, as I have, to the right of column O.


Looking at your dashboard, select cell G6. Set G6 to reference the nation at the top of the list in the VLookup table. So, G6 should have “=H32” as its formula. Now drag G6 down 14 rows. If you see one of your rows start showing a value of “0,” you’ve dragged too far. Now, while looking at your dashboard, select cell O6. Map this cell reference the first weighted score on your VLookup table. O6, then, should have the value “=G32.” Drag down. The preset bar charts should show up automatically.

Now play with every scrollbar on the dashboard.

***

This is a good stopping point for Part 2. I might be working on a Part 3 as time allows. If I end up writing a Part 3, we’ll talk about how to make those bar charts. And, we’ll talk about how to build another graph that shows how each country performed in just one metric. Lastly, we’ll talk about how to populate the top and bottom rankings.

If you're really curious about the incell bar charts, you can see a good discussion on Chandoo's site,
How to Visualize Survey Results using Incell Panel Charts.

Questions? Feel free to ask.

Easy One-Way Sensitivity Analysis on Weighted Sum Models in Excel (Part 1)

3
This article describes what I like to call "Easy One Way Sensitivity Analysis" in Excel.  I've used it before in several dashboards.  If you want to try it out for yourself before reading ahead, both Healthcare dashboards on the Fun Downloads page implement my Easy One Way Sensitivity Analysis method.  Here's a pic of one of those dashboards:


Above, you can use the scroll bars to change the weights for each given metric.  As you change one weight, the others change proportionally, just as you would expect with one-way sensitivity analysis. In Part 1, I discuss how to build the structure that drives this functionality.  In Part 2, I'll discuss how to put it on your dashboard.

Below I begin with a review of sensitivity analysis and weighted-sum models.  If you'd like, you can skip the review and go right to the instructions, here.

Review
The title of this article may seem like a mouthful, but don’t let the technical words fool you.  It’s likely you’ve seen this stuff before.

Imagine, for a moment, you are evaluating the healthcare systems of different nations.  After considerable research and many hours with healthcare experts, you decide there are five key criteria you will use to evaluate each nation’s system.  They are:

Health level - a measure on the overall health of a country
Health distribution - a measure of how equally healthcare resources (above) are distributed across the country
Responsiveness - a measure of the speed of health services, doctor’s choice, amenities, etc.
Responsiveness distribution - a measure of how equally healthcare responsiveness (above) is allocated across the country
Financial fairness - a measure of how citizens in each country “fairly” distribute the financial burden of the healthcare system

Not every metric is equal, however.  And, after some careful thought, you decide that each criterion should be weighted by a proportion of its importance to the overall performance of each system.  The weights are as follows:


This model may not look familiar, but, in fact, it’s the very same criteria and weights used in the landmark World Health Organization study, World Health Report 2000: Health Systems, Improving Performance, which assigned a rank to 191 different countries based on the performance of their healthcare systems.   Indeed, this model is used in many published rankings. It works like this: you define the key metrics about the subject you want to investigate and assign each a weight.  You then collect data about each metric resulting in an overall score for that metric. For example, you could collect surveys from healthcare professionals ranking their healthcare networks on a scale from 1 to 10 and then average the results (I'm simplifying a bit). Finally, you would multiply each metric by its associated weight then sum those products together to come up with an overall score. If you understand me so far, then you get the weighted-sum model.

In the published rankings above, the weighted sum model is used to evaluate many different countries. Broadly, you’re simply investigating a resultant list of alternatives whose scores follow directly from the importance of each input defined in the first step. As such, you may want to investigate how changing the importance of inputs impacts the overall score. This is called sensitivity analysis.

One-Way Sensitivity Analysis

One simple, if powerful, sensitivity analysis method is to vary only one weight at a time while maintaining the proportional importance of the other weights. This is called one-way sensitivity analysis and it works like this:

Say I want to test what happens if I increase Health Level by 4%.  First, lets divide the weights into two theoretical groups,


The rule here is that each group must always sum to 100%. So, if we add 4% to Health Level, we have to subtract it from the other group.


Now that the overall sum of the "other group" has changed, the weights that make up that group are adjusted while maintaining the same proportion to the group's sum as they did before.  First we find the proportion...
Then multiply by the new group weight...


Finally,
...our weights again add up to 100.0%

Easy One-Way Sensitivity Analysis in Excel
The above method may appear daunting, but we can make Excel do most of the work for us. I call my "easy" because it's both straight-forward and requires no VBA to implement.  However, it has some limitations that will become clear by the end.


Step 1 - Set up your calculations table

This is how I set up my calculations tab tab:


Note that I have my weights listed on the left side.  I'm given some space between my weights and my score table.  Note, too, that I have all the multiplication set up.  You'll likely want a similar layout. Of course, to save some time, you can download the workbook above with the layout already set up (use the Example tab).

Step 2 - Insert Form Control Scroll Bars, One for Each Weight 

Go to the Developer tab.  Select Insert > Form Control Scroll bar.  (If you don't see the Developer tab on your Excel screen, you'll need to enable it.)


Insert five different scroll bars below the weights table.  Or, better yet, insert one, then copy and paste.

Step 3 - Link each Scroll Bar 

Insert a new column between columns B and C.  Put a new heading in the new column titled "Linked Weight."  We want to link each scroll bar to a metric so that we can use the scroll bars to change the weights.  To link a scroll bar to a value on a sheet, right click on the left-most scroll bar and select Format Control.  In the Cell link field, select the cell that will hold the current value of the scroll bar. You will also need to set Minimum Value to 1.


From the left-most scroll bar to the right, you'll want to link them to cells starting C3 all the way down to C7. Once the cells have been linked, go ahead and click the down arrows on each scroll bar. You should see the values change as you scroll down. This will also allow you to double-check that each scroll bar is associated with the correct cell.

Step 4 - Adjust Each Value

We have a small problem: the scroll bars increase their cell's values when scrolling down. While there's nothing wrong with that per se, it's counter intuitive to how we think. For our purposes, we'd like the action of scrolling up to actually increase the resulting value and scrolling down to decrease. So we need to adjust the values on the spreadsheet to reflect this preference.
Insert another column between C and D.  Name it "Adjusted Weights."  In each cell next to the Linked Weights, you will take the cell to its left and subtract 100 (the max value of the scroll bar).  You can do this with a formula like the one shown below.


Play around with the scroll bars. Note that the adjusted weights now increase and decrease intuitively.

Step 5 - Sum and Define Proportions

At the bottom of the Adjusted Weight column, add a SUM cell.

Now you will overwrite the values in your Final Weights column.  For each cell in Final Weight, you will divide the cell to its left (in the Adjusted Weight column) by the total sum you've just calculated.  Use the formula below as a guide.


At this point you're finished with Part 1. If you play around with the scroll bars, you will see that you can change the weight of one criteria at a time, while maintaining the proportionality of the others. The final scores update automatically! The scroll bars also adjust the location of the selector (that little gray bar) accordingly.

Limitations

As you may have already noticed, the scroll bars appear to have a limit. (Scroll one of them to its maximum value to see what I mean.) For some applications, this limitation isn't a real problem; but you may create a model where the "easy" method is not useful. Additionally, because we use formulas to derive the final weights, you can't type a desired weight into the Final Weights column without breaking part of the scroll bar mechanism. (But you can fix this problem with some VBA.)
In Part 2, we'll talk about putting this structure into a dashboard layout.

Download the file
One Way Sensitivity Analysis.xlsx

Visualizing.org: Garbage In, Garbage Out

0
There are a lot of awful visualizations and info graphics floating around the internet. I've sent some of the worst I've found to my new internet friend, Kaiser Fung, at JunkCharts. His blog hosts a formidable, if unfortunate, collection of chartjunk and he attempts both to make sense of them as well as to provide suggestions on how to make them better. 

So where do I find these graphics?  I go to Visualizing.org, a site I am finding harder to respect as time goes on.  That might sound harsh, but if the aim of the site is to "make sense of complex issues," I think they often miss this point while giving praise and monetary rewards to data designs that, in fact, make issues harder to understand.  To demonstrate this point consider a recent winning visualization, E-CUBE-LIBRIUM, from a team at Columbia University.  According to the team: 
By configuring social, economic, and environmental data in terms of a "Rubik's Cube" analogy, the cube represents a country's growth with inversely proportional categories placed opposite each other. The 3D extrusions on each cube face is a sustainability indicator, showing volumes where data increases or decreases. From these models, we are able to quickly draw connections and visually identify how each factor affect the equilibrium of the entire system....For example, how do economic gains adversely affect social and environmental health? In each cube, we are searching for stable equilibrium and positive, balanced development that can be sustained over time. Unstable equilibrium may appear to be balanced, but it is not sustainable, due to an irresponsible levels of CO2 emissions, or alarming income and social disparity, for example.
Here's how the country of Chad is represented in the Rubik's cube analogy:


In theory, plotting a country's relevant indicators should give some visual cues and insights. However, their three-dimensional forms obscure much of this data. There is no scale and no way to tell while looking at each figure if a system is balanced, or even how much gain is too much gain. Moreover, so much is represented that we must keep deferring to the legend to figure out exactly what we're looking at.

But there are larger problems that seriously undermine the team's work.  First, this paragraph I excerpted from their write up:
By abstracting data into these virtual objects, they can then be tested for physical properties such as center of gravity, balance point, mass, inertia, aerodynamics, and any number of precise simulation results...The center of gravity of a cube gives us indications as to where a country's development is distorted and which direction the country needs to move in order to achieve balance. Inertia allows us to test for direction of past and future movement - or lack thereof. Aerodynamics would reveal holes and outliers in a country's cube, indicative of a crisis or a boom/bust capitalist cycle.
I'm not sure what to say here except...no, these things aren't possible.  There's a reason we don't test a bar chart for its weight in pounds - or how far we can toss a three-dimensional pie chart like a Frisbee.  Graphs are representations of abstract values in made-up space; they don't have inherent physical properties.    

Which brings me to the second major problem.  Because humans are pattern-oriented, ideas that manifest symmetry and balance can be appealing and convenient.  Consider American politics: you might sit on the left, the right, or smack dab in the middle.  It's an arguably useful simplification; but when you consider where you fall on the political spectrum, is the "ideal" policy truly at the center point?  Put another way, what reason exists to assert that if a country's indicators aren't in "balance", or tending toward some abstract and invented equilibrium, national turmoil will result?  Nothing, of course.

But a steady rise in CO2 emissions sounds like sustainable growth, right?  Maybe, but E-CUBE-LIBRIUM never speaks to this point visually - it's a point asserted in the team's write up.  In fact, nothing new is gained by the visual Rubik's cube.  The actual country indicators by themselves, as numbers, likely do a better job of telling this story, if it exists.

Which brings me to the biggest problem of all: the entire thing is rather heavy-handed.  I believe the designers knew going in which countries they wanted to portray as "unsustainable." Consider,
Unstable equilibrium may appear to be balanced, but it is not sustainable, due to an irresponsible levels of CO2 emissions, or alarming income and social disparity, for example.
Because there's nothing in this visualization that indicates system imbalance, or, for that matter, irresponsible CO2 emissions or alarming social disparity, I’m left wondering if these items aren't just the preconceived notions the designers imposed upon their visualization.  Indeed, the passage appears to argue that their design could give a misleading impression about a country’s stability, that knowledge of a country not presented here (such as social disparity) might mean the appearance of sustainability is incorrect.  Put another way, it doesn't matter what our visualization says, it can't be sustainable because we can't have a country that pollutes at an alarming rate violate our ridiculous analogy. Sounds like confirmation bias to me.  

Apparently, Visualizing.org, Columbia University, and the United Nations disagrees with me (and, to some extent, Newtonian Physics). This team's nonsense won their school $10,000 to continue visualization education.  Hopefully, Columbia will invest in some books on the subject


I'll leave you with this.

A Dynamic Dashboard for Project Durations and Costs in Excel (part 2)

0
In the last post, A Dynamic Dashboard for Project Durations and Costs in Excel, we talked about using VLOOKUP as means to map references to their costs.  At the end of the post, I admitted that I didn't really like the solution.  Specifically, I didn't like how the user had to type in each reference manually and then go back and ensure their numbers were correct (for example, if execution is nine months long, the user would need to ensure they type the number 2, nine times).  In this post, we'll talk about how to automate this process.  When we're finished, you'll only need to type the number 9 into a box and the rest will update automatically.  

The Advanced Method

Step 1: Use the REPT formula
The REPT() formula (short for "Repeat") allows you to repeat a character a certain amount of times.  For example, if A1 has the formula =REPT("A", 6), then A1 will display the value "AAAAAA."  Now think about how that might be useful here.  We could simply input the number "6" for IT Services in the Execution phase and Excel will generate a reference string "222222."

Consider below:

In this case, =REPT(C$11$, C3) is telling Excel to repeat the value 1 (our reference to planning) a total of two times.  In other words,  =REPT(C$11$, C3) -> =REPT("1", 2) -> 11. (Remember, "11" is two 1's, not eleven.)

Step 2: Create the reference string
Now concatenate each string reference (using the concatenation operator "&") to form the entire reference string.

  
Step 3: Read from the reference string using the MID formula into your References Table
The MID formula allows you to take a string and read its characters starting from a specific position to a certain character length.  For example, =MID("Jordan",2,2) returns "or" since the first 2 tells Excel pull from the second character in "Jordan" and the second two tells Excel the amount of characters to return.  For our purposes, we'll only need to return one month at a time.  And since our reference table incidentally uses numbers for months, we'll reuse those numbers to tell the MID formula our desired character position.  When you supply a character position greater than the character length of the given text string, MID simply returns nothing.  

Above, we tell Excel to take the corresponding reference string for IT Services and use Month 1 to pull from position one in the reference string. Fill in the information going across, then down.  

Consider what we've done so far.  Now when you change the information in your Months in Step table, the reference strings change, which makes updates to the Reference Table automatically!
  

Step 4: Convert references to numbers in your Values Table
We have a small problem. Our Reference Table may be displaying the correct information, but it's actually displaying the information as text and not a number (this is because we used String formulas above, which work on and return text).  If we try to add the the numbers for the IT Services row in our Reference Table above, the result will actually be zero since, despite appearances, no numbers actually exist in the row.  Luckily, the fix is simple.  We'll use the VALUE() formula to convert the strings back to numbers.       

Step 5: Ditch VLOOKUP.  We don't need it.
VLOOKUP is best used to look up strings, not numeric values.  I've updated the look up table below.  Take note that each phase is actually intrinsically encoded: Planning is already in row 1; Execution in row 2; and Maturity in row 3.
In this case, we need only use the INDEX() formula.  The INDEX formula allows us to pull from a specific row and/or column in specified range.  For example, we could take the last column above and use the numbers in our Reference Table to identify the desired row.  Take a look below:

The Values Table uses 1 in the References Table to pull from the first row of our lookup. 

Step 6: Use IFERROR for months with zero values
Another small problem.  The INDEX formula above is reading in blank values and returning errors!  You'll need to tell Excel to return $0 for those months.  To do so, you'll use the IFERROR formula.  IFERROR works by attempting to execute a given formula; if the formula returns an error, IFERROR will direct Excel to return another value instead of an error.

Take a look: 


Step 7: Sum the Values Table, then graph


Summary
Hopefully that wasn't too bad.  I wanted to show how many different formulas can interact to create an automated dashboard.  Of course, you could tighten some formulas up.  For example, instead of using VALUES, you could simply use the "--".  And, you could even do away with the IFERROR by retooling your lookup table.  I'll leave that up to you.  


Something to try...
Use the reference table and conditional formatting to create a gannt chart!


We're still missing some desired functionality.  Wouldn't it be neat to be able to set the date when each project begins?  We'll talking about that in Part 3.  Don't miss the riveting, final conclusion!


Download the example file: Dynamic Duration Example.xlsx

A Dynamic Dashboard for Project Durations and Costs in Excel

3
Make sure to checkout A Dynamic Dashboard for Project Durations and Costs in Excel (part 2) for the example file!

Let’s say you are the manager of a portfolio of projects at your company.  While each project under your aegis is different, they have a few things in common; specifically – and for the sake of our example – they all go through (or, are currently in) three different phases, and each phase has a different cost per month, but the cost doesn’t differ between each project.  In our example, the phases are:
Phase Name Cost of each stage per month
1. Planning $250/month
2. Execution $500/month
3. Maturity $125/month
The idea is to capture both the cost in any given month and the overall cost over the life of the project.  For example, you have an IT Upgrades project in your portfolio.  You think that you will spend two months in Planning, nine months in Execution, and one month in Maturity after which the project will be closed.  Thus, the overall cost of your project is expected to be,
Planning @ two months: 2 months * $250 $/month  = $500
Execution @ nine months: 9 months * $500 $/month = $4500
Maturity @ one month: 1 month * $125 $/month = $125
Planning + Execution + Maturity =  $500 + $4500 + $125 = $5125
The problem is that each project is different.  One project might spend more time in the first phase than the other.  Moreover, for some projects you have a good idea of how long they will stay in each phase, and for some you are a bit less sure.  Boy, you say, wouldn't it be nice to change how long a project stays in each phase to compare costs.  Wouldn't it be nice to see it on a chart?  Let's see what we can do.

Using a VLOOKUP might seem like an obvious choice for our solution.  Here's how to do it.   

The Dynamic VLOOKUP Method

Step 1: Create the VLOOKUP table
Since you know there are three projects, you could encode ids into a lookup table numbers as follows.


Step 2: Create a Reference Table
The Reference Table is a time-series table that holds the numerical references to your VLOOKUP table.  If IT Services has two months of Planning, then the Reference Table will show two 1's in the first two months, respectively.

Step 3: Create a Values Table to map each reference to its monthly cost using VLOOKUP
Now, you'll make another table that is essentially a mirror image of your Reference Table. This table, however, maps each reference to the correct cost.  So, for Month 1 in the Values Table, VLOOKUP will use the corresponding reference (1) in the Reference Table to indicate the project is in the Planning phase and the associated cost is $250.


Step 4: Sum the Values Table, then graph


Summary
Our dynamic VLOOKUP() method works: the manager (that's us) can replace the values in the Reference Table to update how long a project stays in each phase.  We would simply repeat numbers in the Reference Table in the amount of months a project is in a particular phase.  Our Values Table automatically updates based on each change.


So here's the thing.  I don't like this method at all.  For one, we need a VLOOKUP in for every month, for every program.  Our example only displayed a few projects in a small time frame, but the real world might have many projects over many years!  That's a real problem because VLOOKUPs can become computationally expensive as our spreadsheet grows.

And there's another problem, too.  The manager – that's us, remember – must hand-jam the references in for every month. What if there are many years to account for?  We could Copy/Paste to make life easier, but this method is so very, very error-prone.  There should be a way for us to simply enter the months a project is in a given phase and have Excel automatically generate all the required reference information.

Let's talk about how to do that in the next post.

If you're having trouble with the work above, take some time to see if you can recreate your own version in Excel.  Even if you have followed everything so far, consider the VLOOKUP method and the importance of using numeric references.  They will play a very key role in part 2. 


-----


Now Available: A Dynamic Dashboard for Project Durations and Costs in Excel (part 2)


Edit button, please

3
This is a long overdue article, my apologies.

The basis of the article surrounds a question in the comments section of an article on Chandoo.org (comment #75) written about the hyperlink() method I discovered and wrote about here. In Chandoo’s example, when a user rolls over different “hotspots” representing different datasets, the corresponding data comes into view on a graph below. In other words, the rollover technique tells Excel to change the data currently being fed into the chart. One of the respondents to his post attempted an associated technique that would create a dynamic hyperlink to the dataset. The goal, essentially, was to create an “edit” button that could bring the user to the dataset in view.

The problem he (and I) ran into was that whenever we updated the link in the Hyperlink formula, the hyperlink's friendly name, “Edit,” would be replaced by the address of the actual link. This resulted in an Edit hyperlink that read something like “Sheet!A1” instead of “Edit Sales.” While the link worked, the result was ugly. We needed to try something different.

So here's my solution. It’s nothing really fancy, but it does require you to keep track of two components: (1) the tab that holds your associated data; and (2) the beginning cell of your associated data. There are, indeed, many ways to keep track of this information, but some planning and organization helps out a lot. One of the easiest organization techniques is to have your data in the same cell for each tab. If your “Sales” data begins in cell B1, then any other data you'd like to use for this technique should also start in B1. Moreover, if you're interested in information from your sales tab, name your tab “Sales” (and your other tabs “expenses,” “income,” etc.).  Similarly, if you are pulling from different databases, tab one could be Database1, tab two Databse2, etc. Alas, not all data can be organized in this manner, but you get the picture. Such organization makes a significant difference when implementing this technique and my example below assumes you have data from tabs Database1, Database2, and Database3.

A Quick Refresher


The dashboard above works the same way as the example used in Chandoos’ post. The cell’s with the down arrows are the rollover hotspots and they contain the required hyperlink formulas.


For example, when the user places his or her mouse of cell B5, C5, or D5 the following code is executed.

Public Function ChangeSelection(i As Integer)
     Range("valSelOption") = i

End Function


Hopefully this is all review for you. If not – or, for a quick refresher – read these:
1. Rollover b8 ov1
2. Interactive Dashboard in Excel using Hyperlinks

On to the Good Stuff

So now we need a button that, when clicked, will take us to the location where the data resides. As you might have noticed from my example above, I placed a textbox on my dashboard with the label “Edit.” This is my edit “hyperlink.” But instead of actually “hyperlinking” to the data, I’ll instead tell Excel to take me to the data with a macro. In my module I’ve written the following code and have assigned it to the textbox.


Public Sub GoToData()

Dim wsCurrent As Excel.Worksheet
Set wsCurrent = Worksheets("Database" & Range("valSelOption"))
wsCurrent.Activate
wsCurrent.Range("B2").Activate
End Sub


Here’s what’s going on. In the earlier code section – my ChangeSelection function – I told excel to change the named range, valSelOption, to an index representing the location where my data resides. But I’ve also named my tabs Database1, Database2, and Database3. Since I placed my data starting in range B2 for each tab, I can use valSelOption to direct Excel to the correct tab. In the above code, I create a worksheet object and assign it to the correct worksheet by concatenating “Database” with valSelOption. In other words, if I valSelOption is 1, then the database we want will be Database1...and so forth.

Also, notice that my code first activates the tab we want before activating the range within it.  This is an important step that must come first or you will surely get an error.

---

So what if your data isn't organized in an easy, uniform way? Well, in my example, you might change cells B3 to D3 to the name of your tabs. And in your ChangeSelection() function you would have a string argument instead of an integer. That could help your program identify the tab housing your data. Again there are different ways to do this.

But if you find that your data is all over the place – consider reorganizing!

-

(I’ll have the file up with this example soon.)

One Size Fits All

30
Anyone who has a made a dashboard in Excel before has probably experienced this problem: a dashboard that fits nicely on your screen but not so nicely on your client’s. Yes, it’s the age old problem of differing monitors, resolutions, font-sizes and other settings that make what looks great on your screen look too small or too big on another’s. I’ve seen a few ideas to get around this problem that include resizing the spreadsheet controls to resizing the Excel window. Here’s my idea.

Most likely, your current Dashboard is already zoomed to its “best view.” By that I mean your current spreadsheet is at the proper zoom level such that your dashboard is displayed most effectively. If it’s not, go ahead and set it to the optimal zoom for your screen. Use the picture below as a guide for your dashboard and adjust the zoom levels (down in the lower-right corner) accordingly.


In this next step you’ll want to take note of the columns spanning your screen. Above, you’ll see that I’ve selected columns “A1:Z1,” but left the final column, “AA1” unselected. I would suggest highlighting all except for the last column as I did above—when we are finished, the last column will act as a nice margin. Jot down your selection; we’ll be using it in a moment.

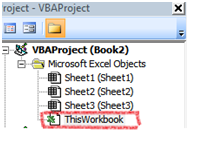
Fire up the Visual Basic editor. Since we want our Dashboard to be in the correct view whenever someone opens the file (otherwise, what’s the use?) we’re going to add some code to be executed right when the workbook is first opened. In the upper-left hand corner of the Visual Basic Editor you’ll see a box labeled Project, which contains your Microsoft Excel objects. Double click ThisWorkbook—the workbook object belonging to our project.


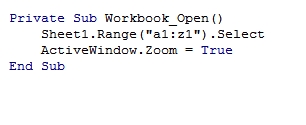
In the code window, select “Workbook” from the object dropdown on the left. Then select the “Open” method from the method dropdown on the right. The Workbook_Open() procedure should appear on the screen as shown below.


Now enter the following code into your new procedure. Remember the range I said to jot down for later? Use that range in the quotes as I have for “A1:Z1.”
Now to see if our code actually works! Go back to the spreadsheet and, for testing purposes, zoom really far out to a level that your dashboard should never go. Now save and quit. (Make sure you save it as a .xlsm macro enabled workbook.)

Open your dashboard! Neat, huh? If you want to make your dashboard super snazzy, take the row selection you jotted down above and do Merge and Center on it. Now add a nice title to it for a nifty dashboard banner.

---

There are a few things I should mention. The user might have to hit “Enable Macros” before the code takes effect, but there’s not a ton you can do about that. And if Excel wasn’t closed correctly on a previous use, that box showing unsaved files will most likely appear and your dashboard, left with less screen real estate, will probably not zoom correctly. Finally, sometimes Excel will not open to a maximized state – but you can fix this with some VBA code.

I’ve found this to be a good workaround in my projects– but I haven’t worked with every different client computer, either. Let me know what you guys think – was this useful? How do you get around displaying the same thing on different screens?

How to Create a Rollover Effect in Excel: Execute a Macro When Your Mouse is over a Cell

362
"Rollover B8 OV1" (like Rollover Beethoven...? get it?)

Update 17 July 2011: This blog entry was featured in Chandoo's latest post. So if you're coming here from his site -- welcome!

original post:
This post was inspired by Chandoo's post on hyperlinks in Excel. If you haven't checked his website out yet - you should. It's excellent.

In this post, I suggest a method for creating a "Rollover" effect for your mouse on an Excel spreadsheet. Rollover techniques (also called "Mouseovers") are useful to (1) display quick information to the user; (2) to execute a function when a user puts their mouse over a specific region; and (3) to make neat graphical effects.

For item 1, my technique isn't really necessary. If you want to display brief information to the user when he or she rolls over a cell, the best way to do this is to insert a comment.

But comments are pretty limited. You can only write so much information in a comment before it becomes too cluttered to be useful. Moreover, comments are static. What if you want the information concerning the "target" cell (that is, the cell to be rolled over) to change based on different items in your spreadsheet? We can use the in-cell Hyperlink() formula to accomplish this.

The Hyperlink() formula looks like this:

=Hyperlink(location, [Friendly Text])
location - Here you write the intended address of your hyperlink. This can be a webpage (i.e. "http://www.google.com") or a file on your computer.
[Friendly Text] - This is an optional field that provides a caption to your hyperlink. If you leave it blank, it will simply display the address in the previous parameter.

To begin our example, you'll need to create a User Defined Function (UDF) to be executed when the rollover event is initiated. So go into the Visual Basic Environment, create or find a free module and create a UDF that looks something like this.

Public Function MyMouseOverEvent()
Sheet1.Range("A1").Value = "Event Fired!"
End Function
I can understand if you're puzzled at this point. UDFs are not really allowed to change values in other cells. However, since we'll be calling this function from within the Hyperlink() formula, you'll see this limitation no longer exists.

So now go to Sheet1 and click on cell A2. In that cell, type in the following formula:

=HYPERLINK(MyMouseOverEvent(),"Click here")
Upon hitting Enter, you should get a #VALUE! error, but ignore it for a second. Roll your mouse over cell A2 - and viola! - Cell A1 should now say "Event Fired!"

But what about that pesky #VALUE! error? Remember the limitation that UDFs can't change other cells? Well, even though Excel let's you change a value from within your UDF, it still recognizes that it wasn't supposed to! To get rid of that error is pretty simple. Just rewrite the function in your cell as follows:

=IFERROR(HYPERLINK(MyMouseOverEvent(),"Click here"), "Click here")

And that's it. If you like this technique and find some cool uses for it, drop me an email and show me.

Here's some graphical fun I created using this technique. Putting the mouse inside the black rectangle creates a fading snake-like pattern based on your mouse movements. Check out the screen capture:


Make sure to check out my latest (and greatest) example of this technique, here: